


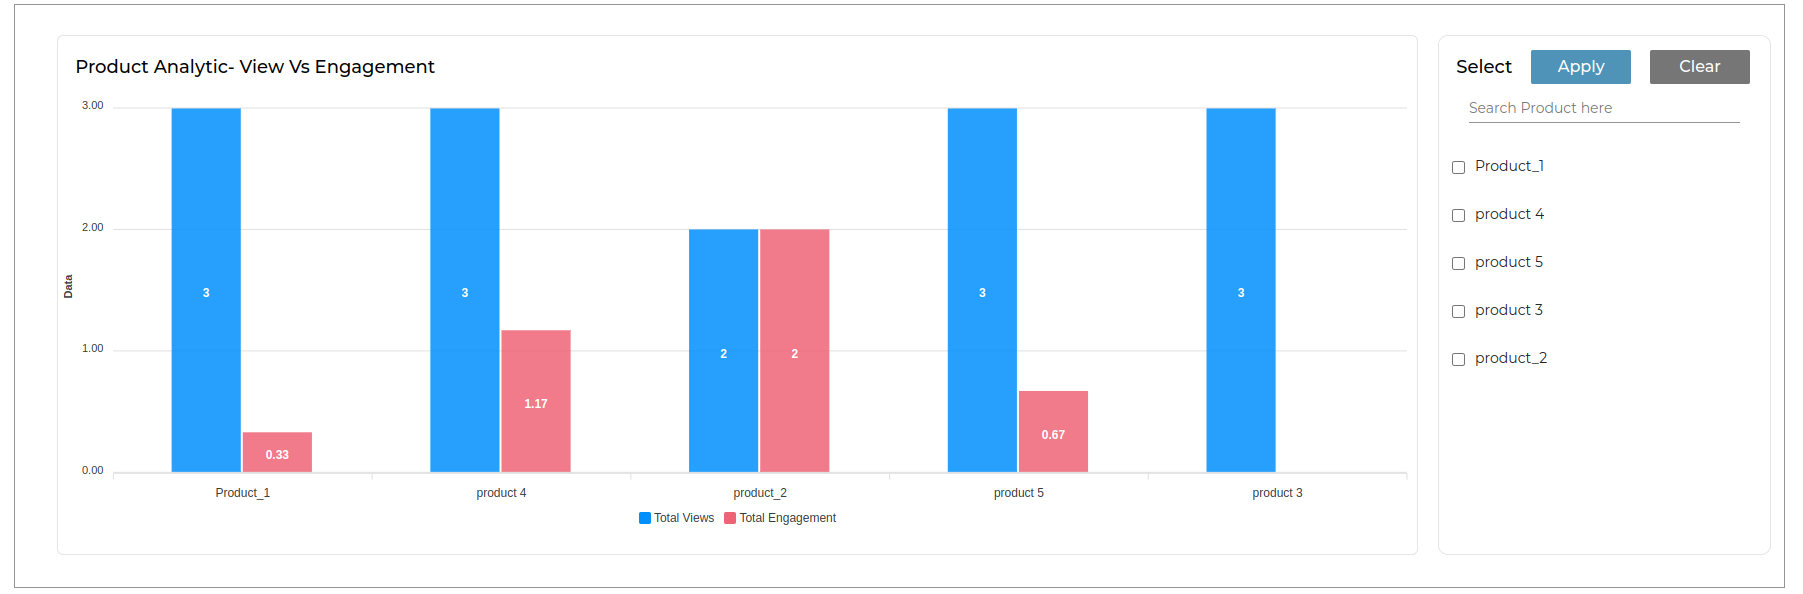
View Vs. Engagement:
- Explore the correlation between product views and actual engagement or purchases:
- This analysis delves into the relationship between the number of views a product receives and the level of engagement it generates, such as clicks, interactions, or purchases. By examining this correlation, you can gain insights into the effectiveness of product presentation, descriptions, and overall appeal to customers.
- Understanding the correlation between views and engagement helps in evaluating the performance of individual products within your inventory. Products with a high number of views but low engagement might indicate a need for improvements in product descriptions, pricing, or imagery to better align with customer expectations.
- Conversely, products with high views and strong engagement metrics indicate a healthy level of interest from potential customers, which can guide inventory management decisions, marketing strategies, and product placement on your website.
- By analyzing view-to-engagement ratios across different products, you can identify patterns and trends that inform strategic decisions regarding product positioning, pricing adjustments, and promotional efforts. This analysis ultimately helps in maximizing the effectiveness of your product offerings and driving conversions.
- Explore the correlation between product views and actual engagement or purchases:
Average Store View Per Day:
- Discuss the average number of store views per day and its implications:
- The average store views per day metric provides valuable insights into the overall traffic and visibility of your online store. It represents the average number of times your store’s pages are viewed by visitors within a single day.
- A higher average number of store views per day indicates a greater level of visibility and exposure for your online store, potentially leading to increased opportunities for customer engagement, conversions, and revenue generation.
- Understanding the average store views per day helps in assessing the effectiveness of your marketing efforts, search engine optimization (SEO) strategies, and overall online presence. It enables you to gauge the impact of various marketing campaigns, promotions, and content initiatives on driving traffic to your store.
- Monitoring fluctuations in the average store views per day over time allows you to identify seasonal trends, patterns in customer behavior, and areas for improvement in your website’s user experience. This insight can inform strategic decisions related to content creation, website optimization, and customer acquisition efforts.
- By benchmarking your store’s average views per day against industry standards and competitors, you can gain a better understanding of your market position and identify opportunities for growth and expansion. This analysis serves as a key performance indicator (KPI) for evaluating the overall health and success of your online store.
- Discuss the average number of store views per day and its implications:


