


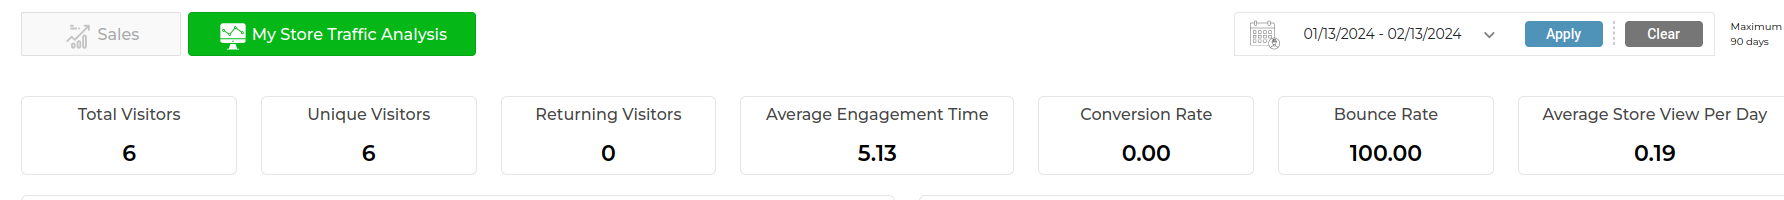
1. Total Visitors
- The total number of visitors who have accessed your online store within a specified timeframe.
- Total visitors, in the context of e-commerce and website analytics, refers to the aggregate number of individuals who have visited a website within a specific period of time. This metric is fundamental in understanding the reach, engagement, and performance of a website in attracting and retaining visitors.
- Analyzing the total visitors metric provides valuable insights into various aspects of website performance and user behavior. By tracking trends in total visitors over time, businesses can assess the effectiveness of their marketing efforts, content strategies, and user experience design in driving traffic to their website. Additionally, comparing total visitors across different time periods allows businesses to identify seasonal trends, promotional impacts, and opportunities for targeted marketing initiatives.
2. Unique Visitors
- The number of distinct individuals who have visited your store within a given period, regardless of the number of times they have visited.
- Offers insights into the size of your potential customer base and indicates the effectiveness of your marketing efforts in attracting new visitors.
- Unique visitors, also known as unique users or unique visitors, are individuals who visit a website or online platform within a specific time frame, typically identified by a unique IP address, cookie, or other tracking mechanism. Unlike total visitors, which count all visits to a website including multiple visits from the same individual, unique visitors represent the distinct number of individuals who have accessed the website during the specified period.
- Analyzing the metric of unique visitors provides valuable insights into the reach and engagement of a website, as well as the effectiveness of marketing efforts in attracting new visitors. By tracking trends in unique visitors over time, businesses can assess the growth of their audience and the success of their acquisition strategies in reaching new potential customers.
- unique visitors represent a critical metric for evaluating the reach, engagement, and effectiveness of a website in attracting new visitors and engaging with potential customers. By analyzing trends in unique visitors data and leveraging insights to optimize marketing strategies, content relevance, and user experience design, businesses can drive audience growth, improve visitor engagement, and ultimately achieve their business goals in the competitive online landscape.
3. Returning Visitors
- The number of visitors who have returned to your store for multiple visits within a specified timeframe.
- Reflects customer loyalty and the effectiveness of your store in retaining visitors over time.
- Returning visitors, also known as repeat visitors or returning users, are individuals who have visited a website or online platform on more than one occasion within a specific time frame. These visitors have previously interacted with the website or platform and have returned for additional visits, indicating a level of interest or engagement with the content, products, or services offered.
- Analyzing the metric of returning visitors provides valuable insights into the loyalty, engagement, and retention of users on a website. By tracking trends in returning visitors over time, businesses can assess the effectiveness of their content, user experience, and marketing strategies in encouraging repeat visits and fostering long-term relationships with their audience.
- returning visitors represent a critical metric for evaluating the loyalty, engagement, and retention of users on a website. By analyzing trends in returning visitors data and leveraging insights to optimize content, user experience, and marketing strategies, businesses can increase audience engagement, drive repeat visits, and ultimately achieve their business goals in the competitive online landscape.
4. Average Engagement Time
- The average duration for which visitors interact with your store, including time spent browsing pages, viewing products, and engaging with content.
- Indicates the level of interest and engagement among visitors, helping you gauge the effectiveness of your website content and user experience.
- Average engagement time, also known as average session duration, is a key metric in website analytics that measures the average amount of time visitors spend actively engaging with a website or online platform during a single session. This metric provides valuable insights into the level of user engagement, content relevance, and overall user experience on the website.
- Analyzing the average engagement time metric offers businesses valuable insights into the effectiveness of their content, user interface, and navigation in capturing and retaining visitors’ attention. By tracking trends in average engagement time over time, businesses can assess the impact of website changes, content updates, and marketing campaigns on user engagement and satisfaction.
- average engagement time is a critical metric for evaluating user engagement, content relevance, and overall user experience on a website. By analyzing trends in average engagement time data and leveraging insights to optimize content, user experience, and marketing strategies, businesses can increase audience engagement, drive conversions, and ultimately achieve their business objectives in the competitive online landscape.
5. Conversion Rate
- The percentage of visitors who take a desired action on your website, such as making a purchase, signing up for a newsletter, or filling out a contact form.
- Serves as a key performance indicator (KPI) for measuring the effectiveness of your website in driving desired outcomes and generating revenue.
- Conversion rate is a fundamental metric in digital marketing and e-commerce that measures the percentage of website visitors who complete a desired action or goal, such as making a purchase, signing up for a newsletter, or filling out a contact form. It serves as a key performance indicator for assessing the effectiveness of marketing campaigns, website design, and user experience in driving desired outcomes.
- Analyzing the conversion rate provides valuable insights into the efficiency of a website in converting visitors into customers or leads. By tracking trends in conversion rate over time, businesses can evaluate the impact of various factors, such as changes in website design, marketing messaging, or product offerings, on user behavior and conversion performance.
6. Bounce Rate
- The percentage of visitors who navigate away from your website after viewing only one page, without interacting further.
- Indicates the relevance and engagement level of your landing pages, with lower bounce rates typically indicating better user experience and content relevance.
- Conversion rate is a fundamental metric in digital marketing and e-commerce that measures the percentage of website visitors who complete a desired action or goal, such as making a purchase, signing up for a newsletter, or filling out a contact form. It serves as a key performance indicator for assessing the effectiveness of marketing campaigns, website design, and user experience in driving desired outcomes.
- Analyzing the conversion rate provides valuable insights into the efficiency of a website in converting visitors into customers or leads. By tracking trends in conversion rate over time, businesses can evaluate the impact of various factors, such as changes in website design, marketing messaging, or product offerings, on user behavior and conversion performance.
- bounce rate is a critical metric for evaluating website performance, user engagement, and content relevance. By analyzing bounce rate data and implementing strategies to optimize website performance and user experience, businesses can reduce bounce rate, improve user engagement, and achieve their business objectives in the competitive online landscape.
7. Average Store View Per Day
- The average number of times your online store is viewed by visitors each day.
- Provides insights into the frequency of visits to your store, helping you understand daily traffic patterns and identify peak periods of activity.
- “Average Store View Per Day” is a metric used in e-commerce to measure the average number of times a particular online store or product page is viewed by visitors within a single day. This metric is crucial for evaluating the popularity and visibility of specific products or sections within an online store.
- Analyzing the average store view per day provides valuable insights into the performance and attractiveness of different products or sections within an e-commerce website. By tracking this metric over time, businesses can identify trends in user interest, product popularity, and overall website traffic patterns. This insight enables businesses to make informed decisions regarding product placement, marketing strategies, and inventory management to maximize sales and customer satisfaction.
- the average store view per day is a critical metric for evaluating the performance and popularity of specific products or sections within an e-commerce website. By analyzing trends in this metric and implementing strategies to increase store views, businesses can drive traffic, engagement, and sales, ultimately achieving their business objectives in the competitive online marketplace.


