


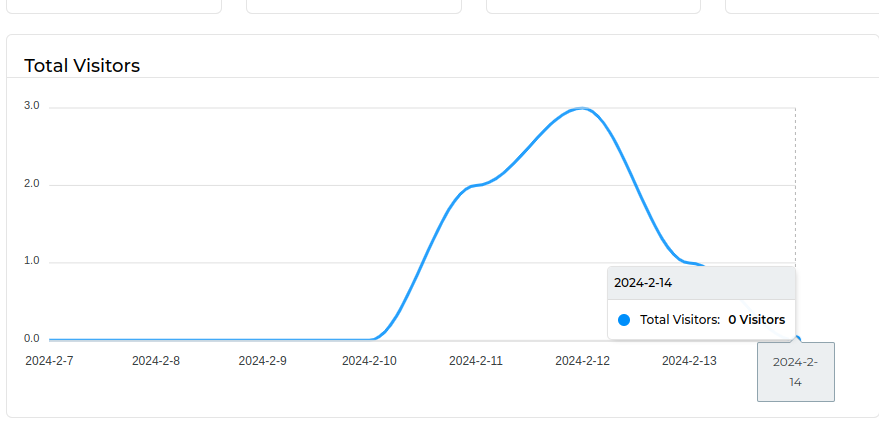
The Total Visitors Graph provides a comprehensive overview of the trends in total visitor numbers over a specified period of time. This graph showcases the overall volume of visitors, regardless of whether they are repeat visitors or unique individuals. By visualizing the total number of visitors over time, stakeholders can quickly discern patterns such as growth trends, seasonal fluctuations, or periods of increased activity. This graph serves as a valuable tool for analyzing the overall performance and popularity of a website, event, or any other entity that attracts visitors.


Ship Rocket
This video discusses about Shiprocket, complete Ship rocket review. It is India's most-used eCommerce logistics and shipping software solution.


